
What Are Bollinger Bands? A Beginner’s Guide
What Are Bollinger Bands? A Beginner’s Guide
Bollinger Bands are a popular technical analysis tool used by traders to understand market volatility and identify potential buy or sell opportunities. Invented by John Bollinger in the 1980s, this indicator is widely used across stock, forex, and crypto markets.
How Bollinger Bands Work
Bollinger Bands consist of three lines plotted on a price chart:
- Middle Band: A simple moving average (SMA), typically 20-period
- Upper Band: Middle band + 2 standard deviations
- Lower Band: Middle band − 2 standard deviations
These bands dynamically expand and contract based on the asset’s volatility.
Why Traders Use Bollinger Bands
- To detect overbought and oversold conditions
- To identify periods of low or high volatility
- To anticipate potential breakouts or reversals
- To confirm entries and exits in trading strategies
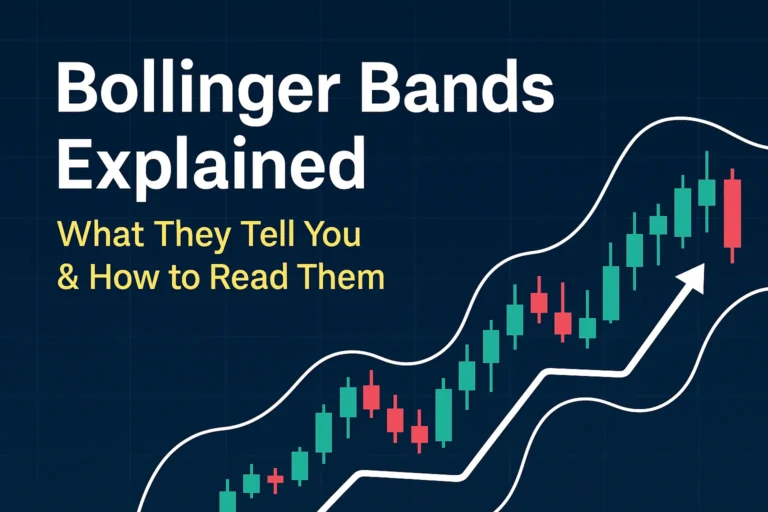
Example: Visualizing the Bands
Imagine the bands as a rubber band around price. When the price moves toward the upper band, it may be overbought. When it approaches the lower band, it may be oversold.
How to Interpret Bollinger Bands
| Signal | Meaning |
|---|---|
| Price touches upper band | Potential resistance or overbought |
| Price touches lower band | Potential support or oversold |
| Bands narrow (squeeze) | Low volatility – breakout may follow |
| Bands widen | High volatility – trend continuation |
Who Can Use Bollinger Bands?
- Beginners to visualize price range
- Day traders to detect volatility
- Swing traders to time entries and exits
- Crypto and Forex traders to adapt to fast-moving markets
Final Thoughts
Bollinger Bands are not just lines on a chart — they are a dynamic tool that adapts to the market’s volatility. While powerful, they work best when combined with other indicators like RSI or MACD for confirmation.
If you’re new to technical analysis, Bollinger Bands are a great place to start.
✅ FAQs
Q1: What do Bollinger Bands tell you?
They show volatility and potential price reversal zones by measuring how far the price deviates from its moving average.
Q2: Are Bollinger Bands good for beginners?
Yes. They are visual, easy to interpret, and highly useful for identifying trading opportunities.
Q3: What settings are used for Bollinger Bands?
The default is a 20-period SMA with bands set at 2 standard deviations.
Q4: Are Bollinger Bands reliable?
They are reliable for volatility analysis but should be used with confirmation tools like volume or RSI.
Q5: Can I use Bollinger Bands for crypto?
Absolutely. Bollinger Bands work well across stocks, forex, and cryptocurrencies like Bitcoin or XRP.