How to Use Bollinger Bands for Day Trading: A Practical Guide
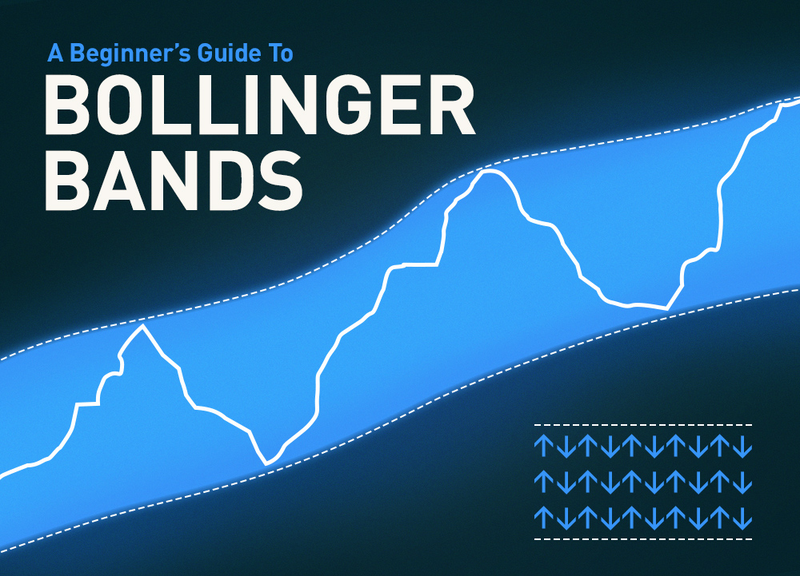
Day trading demands speed, precision, and reliable signals. One of the most effective tools in a day trader’s arsenal is the Bollinger Bands indicator. When used correctly, it can help you spot short-term breakouts, reversals, and scalp opportunities with clarity and confidence.
Why Use Bollinger Bands for Day Trading?
- They adjust in real-time to market volatility
- Help identify overbought/oversold zones
- Reveal squeeze conditions that precede sharp moves
- Work well on 1m to 1H timeframes
Recommended Settings for Day Trading
| Setting | Value |
|---|---|
| Period | 10 to 15 |
| Standard Deviation | 1.5 to 2 |
| Timeframes | 1m, 5m, 15m, 1H |
Start with the default (20,2), then adjust based on the asset’s volatility.
Day Trading Strategies with Bollinger Bands
1. The Bollinger Squeeze Breakout
- Look for a period where the bands narrow significantly
- Wait for a breakout candle that closes outside the band
- Confirm with volume or momentum indicators (e.g., MACD or RSI)
Example:
On a 5-minute chart, EUR/USD squeezes tightly. A bullish candle breaks the upper band with rising volume → Enter long.
2. The Quick Band Reversal
- Price touches the upper band + RSI shows overbought → short
- Price hits lower band + RSI oversold → long
Target: the middle band or a quick scalp of 10–30 pips (or cents in stocks)
3. Trend-Riding Pullback Entry
- Price trends upward and rides the upper band
- Enter on retracement to the middle band
- Exit at next touch of upper band
This is a momentum strategy that keeps you aligned with the trend.
✅ Tips for Day Traders
- Trade high-volume assets to avoid false signals
- Use tight stop-losses just outside the band
- Don’t blindly trade every band touch—wait for confirmation
- Backtest your setup on different markets and sessions
✅ FAQs
Q1: Can I use Bollinger Bands alone for day trading?
You can, but combining them with RSI or MACD improves accuracy.
Q2: What is the best timeframe for this strategy?
15-minute charts are a sweet spot for balancing speed and reliability.
Q3: Should I change the default settings?
Yes, try 10- or 15-period with 1.5–2 standard deviations for faster reactions.
Q4: Do they work in trending markets?
Yes. In trends, look for band riding setups or retracements to the middle band.
Q5: What’s the biggest mistake to avoid?
Entering too early without confirmation—patience is key in day trading.


