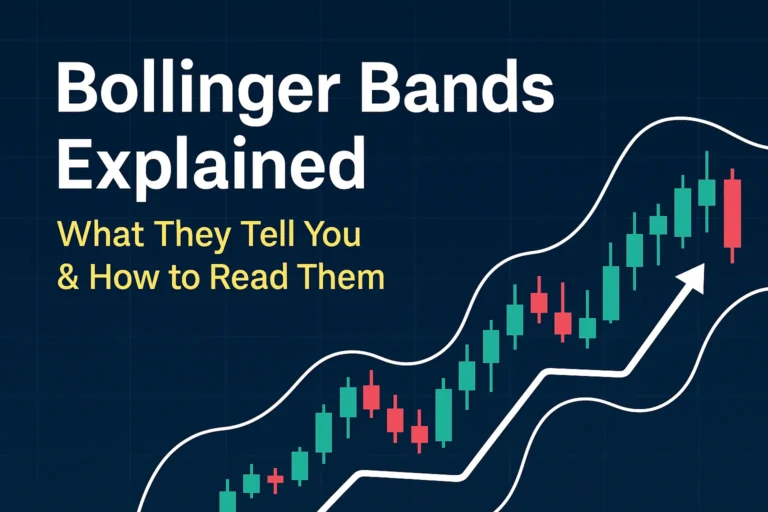
Bollinger Bands Formula: How Are They Calculated?
Bollinger Bands Formula: How Are They Calculated?
Understanding how Bollinger Bands are calculated is essential for using them effectively. While most charting platforms do the math for you, knowing the formula gives you deeper insight into how volatility is measured.
The Core of Bollinger Bands
Bollinger Bands consist of three lines:
- Middle Band: 20-period Simple Moving Average (SMA)
- Upper Band: SMA + 2 × Standard Deviation
- Lower Band: SMA − 2 × Standard Deviation
Step-by-Step Calculation
1. Calculate the 20-Period SMA
This is the average of the last 20 closing prices:
iniCopyEditSMA = (P1 + P2 + ... + P20) / 20
2. Determine the Standard Deviation
Standard deviation (SD) measures how far each price is from the average.
iniCopyEditSD = √[Σ (Price - SMA)² / N]
- A high SD = high volatility
- A low SD = low volatility
3. Calculate the Upper and Lower Bands
arduinoCopyEditUpper Band = SMA + (SD × 2)
Lower Band = SMA − (SD × 2)
Most traders use 2 standard deviations, but some may use 1.5 or 2.5 depending on strategy.
Why the Formula Matters
- It adapts to changing market conditions
- It makes Bollinger Bands a dynamic indicator
- It helps distinguish between consolidation and breakout periods
Example Calculation (Simplified)
Let’s say:
- 20-period SMA = 100
- Standard Deviation = 2.5
Then:
- Upper Band = 100 + (2 × 2.5) = 105
- Lower Band = 100 − (2 × 2.5) = 95
This forms a price envelope between 95 and 105.
Formula Flexibility: Can You Adjust It?
Yes. You can modify:
- Period length (e.g., 10, 20, 50)
- Standard deviation multiplier (e.g., 1.5 or 2.5)
Shorter periods = faster signals, but more noise.
Longer periods = slower signals, but more reliable.
✅ FAQs
Q1: What is the default Bollinger Bands formula?
The default is a 20-period SMA and 2 standard deviations above and below.
Q2: Can I use EMA instead of SMA?
While not traditional, some traders experiment with EMA. However, John Bollinger recommends SMA.
Q3: What does standard deviation do in the formula?
It adjusts the bands based on how volatile the price is. More volatility = wider bands.
Q4: Are the bands fixed or dynamic?
They’re dynamic. They expand and contract based on price movement and volatility.
Q5: Do I need to calculate this manually?
No. Any modern charting platform like TradingView, MT4, or ThinkorSwim calculates it for you automatically.


