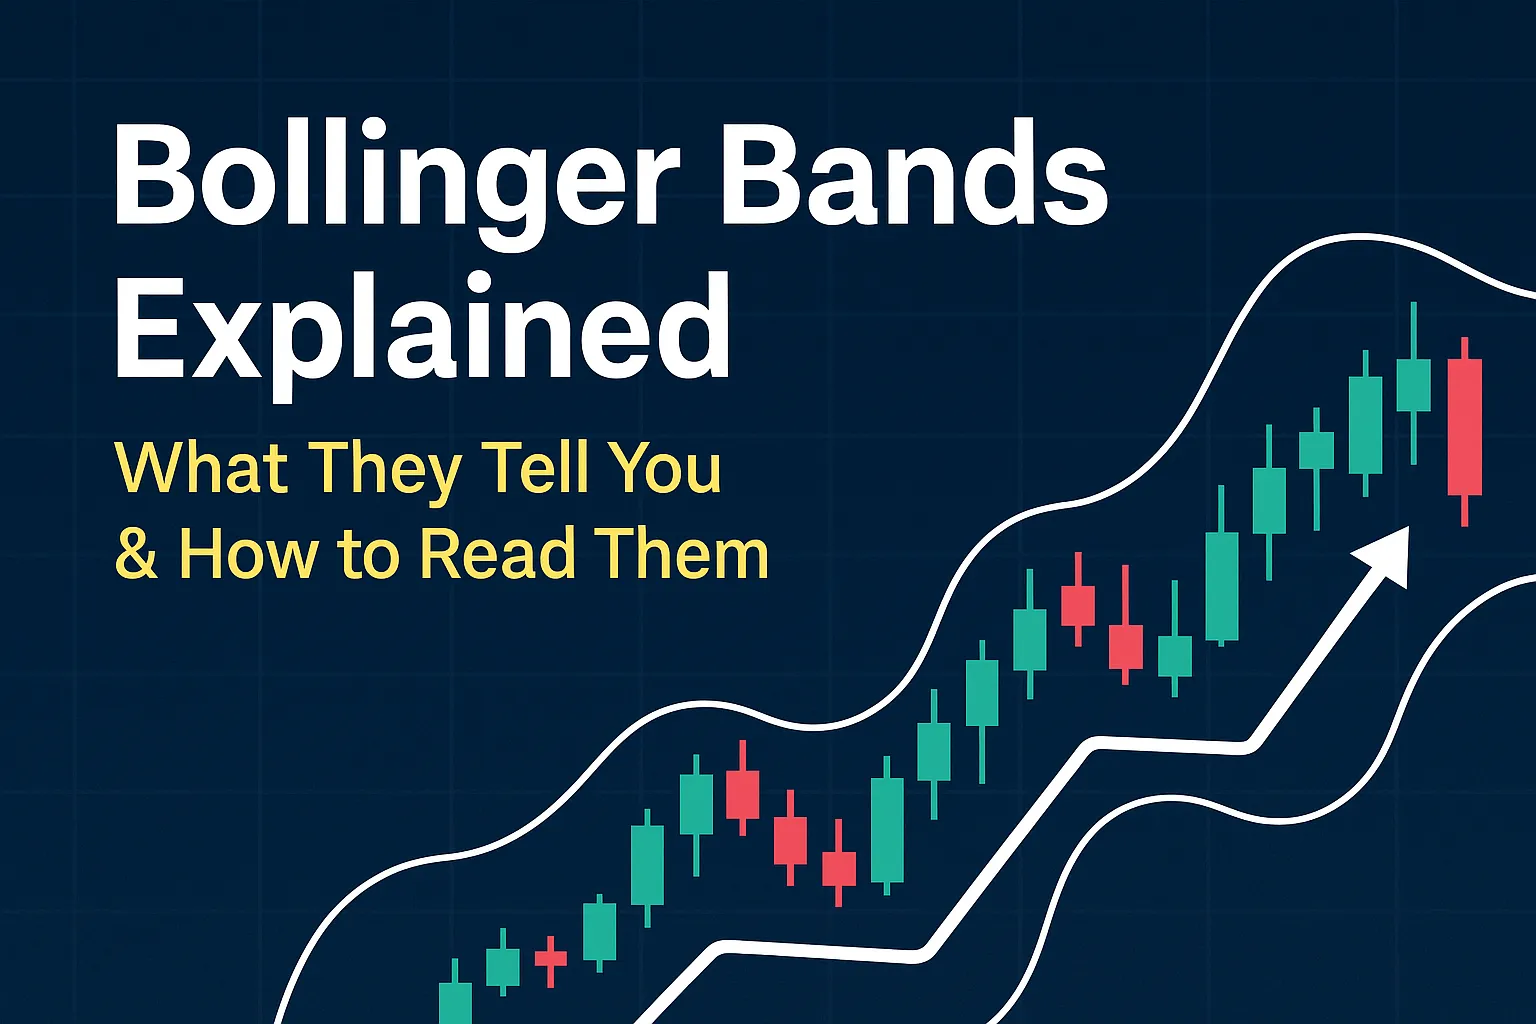
Bollinger Bands Explained: What They Tell You & How to Read Them
Bollinger Bands Explained: What They Tell You & How to Read Them
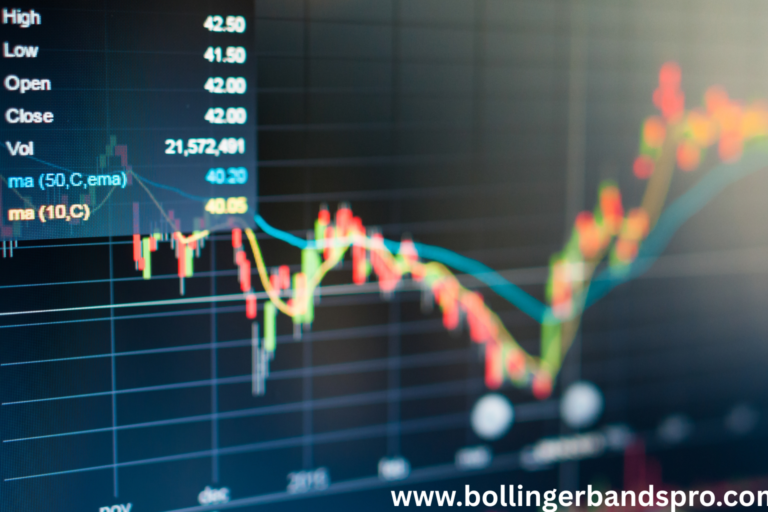
Bollinger Bands are more than just lines on a chart—they offer powerful insights into market conditions. By showing how price behaves relative to its moving average, Bollinger Bands help traders identify volatility, momentum shifts, and potential reversal zones.
What Are the 3 Components of Bollinger Bands?
- Middle Band – A 20-period Simple Moving Average (SMA)
- Upper Band – SMA + 2 standard deviations
- Lower Band – SMA − 2 standard deviations
These bands form a dynamic envelope around price, adjusting in real-time as market volatility changes.
What Do Bollinger Bands Tell You?
- Volatility levels: Wide bands = high volatility; narrow bands = low volatility
- Overbought or oversold signals: Price touching upper band may suggest overbought; lower band may suggest oversold
- Potential breakouts: A squeeze (bands tightening) often leads to a breakout
How to Read Bollinger Bands Like a Trader
| Chart Behavior | Meaning |
|---|---|
| Price riding upper band | Strong uptrend – avoid shorting |
| Price hugging lower band | Strong downtrend – avoid buying |
| Band squeeze | Consolidation – prepare for breakout |
| Sharp band expansion | Volatility spike – act quickly |
Common Misinterpretations to Avoid
- Bands are not support/resistance lines – They reflect volatility, not fixed levels.
- Touching a band ≠ automatic reversal – Look for confirmation (e.g., RSI divergence).
When Bollinger Bands Work Best
- During sideways or consolidating markets
- When used with confirming indicators like RSI or MACD
- For spotting early breakout signals
Example Setup
- Wait for a Bollinger Squeeze
- Confirm volume or momentum surge
- Enter trade in breakout direction
- Use opposite band or recent high/low as target
✅ FAQs
Q1: What do Bollinger Bands indicate?
They measure market volatility and help identify whether prices are high or low relative to recent trends.
Q2: What happens when Bollinger Bands are tight?
This is called a “squeeze” and often signals a breakout is coming.
Q3: How do I confirm a signal from Bollinger Bands?
Use tools like RSI, MACD, or price action patterns for confirmation.
Q4: Are Bollinger Bands predictive or reactive?
They are reactive indicators that respond to price movements, but patterns like the squeeze can suggest upcoming action.
Q5: Can I use Bollinger Bands with candlestick analysis?
Yes! Combining Bollinger Bands with candlestick patterns (like engulfing or hammer) strengthens your setup.