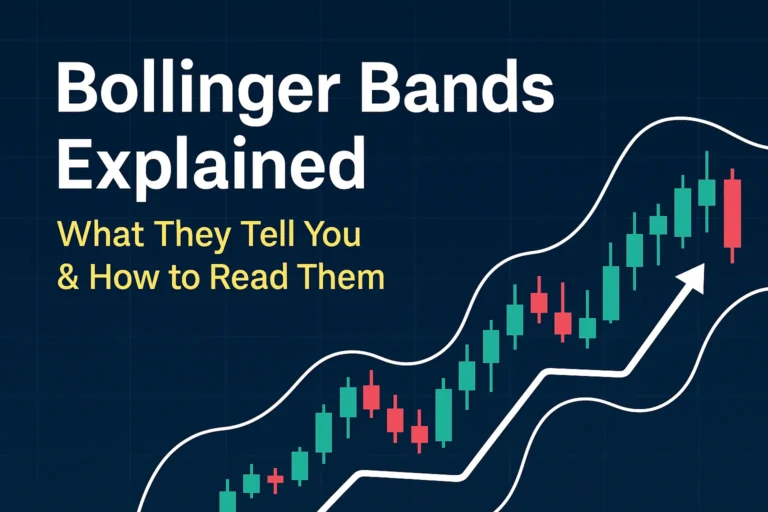

How to Read Bollinger Bands Charts (Beginner’s Tutorial)
How to Read Bollinger Bands Charts (Beginner’s Tutorial)
Bollinger Bands charts can seem complex at first, but with a little guidance, they become one of the easiest technical indicators to interpret. Whether you trade stocks, crypto, or forex, this guide will help you read Bollinger Bands like a pro.
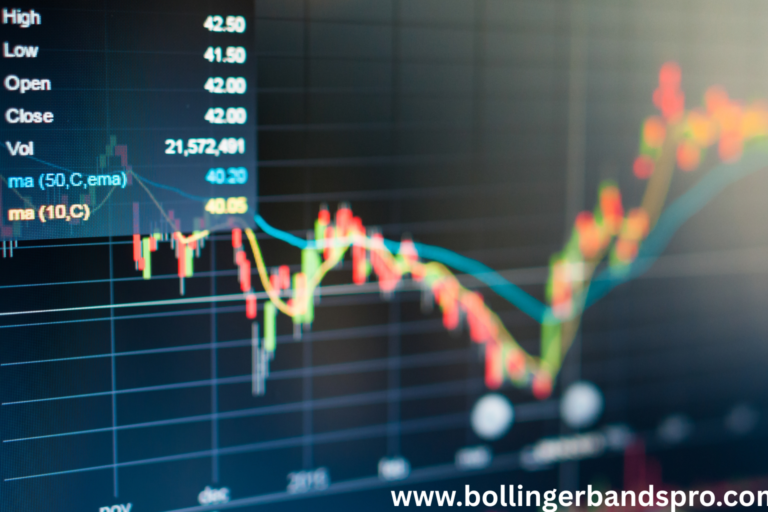
What Does a Bollinger Bands Chart Look Like?
A Bollinger Bands chart consists of:
- A middle band (20-period moving average)
- An upper band (SMA + 2 standard deviations)
- A lower band (SMA − 2 standard deviations)
These three bands wrap around the price, forming a visual envelope that reacts to volatility.
How to Interpret Bollinger Bands Behavior
| Chart Signal | Meaning |
|---|---|
| Bands expand | Market is becoming more volatile |
| Bands contract (squeeze) | Market is consolidating; breakout may be near |
| Price touches upper band | Possible overbought condition |
| Price touches lower band | Possible oversold condition |
| Price hugs upper band | Strong uptrend (momentum confirmation) |
| Price hugs lower band | Strong downtrend (momentum confirmation) |
Step-by-Step: Reading a Bollinger Bands Chart
- Look at Band Width
- Narrow = calm market
- Wide = active, high-volatility market
- Watch Price Interaction
- Price bouncing between bands = ranging market
- Price breaking through bands = trending market
- Identify the Squeeze
- When bands become very narrow, a breakout often follows
Common Patterns on Bollinger Charts
- Bollinger Bounce
Price bounces from one band to the opposite—common in sideways markets. - Bollinger Squeeze
A tight band range that leads to a sharp breakout—look for volume confirmation. - Band Riding
In strong trends, price can “ride” the outer band—don’t assume reversal too soon.
Tips for Beginners
- Use Bollinger Bands with RSI or MACD for better accuracy.
- Don’t assume that touching a band means “buy” or “sell.”
- Learn to read context—band behavior changes with market conditions.
✅ FAQs
Q1: What does it mean when the bands are tight?
It usually signals a period of low volatility and potential breakout ahead.
Q2: What time frame is best for reading Bollinger Bands?
It depends on your strategy. Day traders use 5m–15m charts, while swing traders may use 1H–1D.
Q3: Should I enter a trade when the price hits a band?
Not always. Look for confirmation from price action or another indicator.
Q4: Can I use Bollinger Bands alone?
Yes, but it’s safer to combine them with volume or momentum indicators.
Q5: What’s the most important thing to observe in the chart?
Band width and price direction—they tell you whether the market is calm, trending, or about to explode.